Understanding the Stock Market: Key Terms & Concepts
Core Stock Market Terms

Understanding the stock market can feel overwhelming at first, but learning a few core terms can make a big difference. Whether you’re just starting out or looking to brush up on your knowledge, these key concepts will help you navigate the world of investing with more confidence.
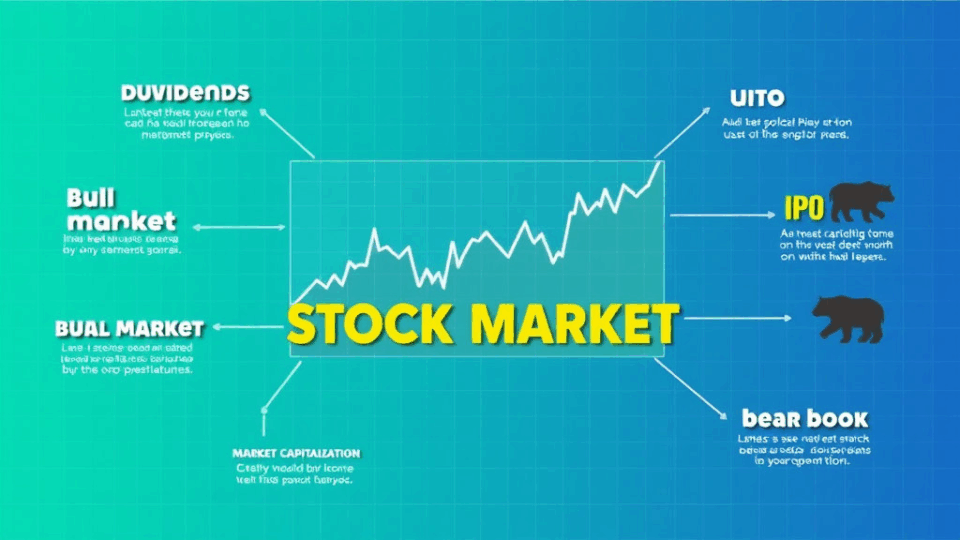
1. Stock: A stock represents ownership in a company. When you buy a stock, you own a small piece of that company, known as a share.
2. Shareholder: If you own stock in a company, you are a shareholder. This means you may receive dividends and have voting rights in certain company decisions.
3. Dividend: A dividend is a portion of a company’s earnings paid to shareholders. Not all companies pay dividends, but those that do often distribute them quarterly.
4. Bull Market: A bull market refers to a period when stock prices are rising or are expected to rise. It’s generally seen as a sign of investor confidence and economic growth.
5. Bear Market: The opposite of a bull market, a bear market is when stock prices are falling. It often reflects pessimism and can be triggered by economic downturns.
6. Market Capitalization (Market Cap): This is the total value of a company’s outstanding shares. It’s calculated by multiplying the stock price by the number of shares. It helps investors understand the size of a company.
7. IPO (Initial Public Offering): When a company offers its shares to the public for the first time, it’s called an IPO. This is how many companies raise capital to grow their business.
8. Index: A stock market index, like the S&P 500 or Dow Jones, tracks the performance of a group of stocks. It’s often used to gauge the overall health of the market.
9. Portfolio: Your portfolio is the collection of all your investments, including stocks, bonds, and other assets. A diversified portfolio can help manage risk.
10. Volatility: This refers to how much a stock’s price fluctuates. High volatility means big price swings, while low volatility indicates more stable prices.
Learning these terms is a great first step toward becoming a more informed investor. Remember, the more you understand, the better decisions you can make with your money. Happy investing!
Trading & Price Action Concepts

Understanding trading and price action is essential for anyone looking to navigate the stock market with confidence. At its core, price action refers to the movement of a stock’s price over time, often analyzed without relying on indicators. Instead, traders observe patterns, candlestick formations, and key support and resistance levels to make informed decisions.
One of the most important concepts in price action trading is the idea of trend. A trend is the general direction in which a stock’s price is moving—upward (bullish), downward (bearish), or sideways (consolidation). Recognizing these trends early can help you align your trades with the market’s momentum.
Another key element is support and resistance. Support is a price level where a stock tends to stop falling and may bounce back up, while resistance is where it tends to stop rising and might reverse downward. These levels are often used by traders to plan entry and exit points.
Candlestick patterns also play a big role in price action. Patterns like the Doji, Hammer, and Engulfing candles can provide clues about potential reversals or continuations in price. While no pattern guarantees success, understanding them can give you an edge in reading market sentiment.
By learning these trading and price action concepts, you empower yourself to make smarter, more strategic decisions in the market. Whether you’re a beginner or refining your skills, these insights can help you grow as a trader and protect your investments.
Key Financial Ratios Explained

Understanding financial ratios is like learning the language of investing — it helps you make smarter decisions and better understand a company’s health. Whether you’re a beginner or brushing up on your knowledge, these key ratios can guide you in evaluating a stock’s performance and potential.
1. Price-to-Earnings (P/E) Ratio: This ratio compares a company’s current share price to its earnings per share (EPS). A high P/E might mean the stock is overvalued, or that investors expect high growth in the future. A low P/E could suggest the opposite. It’s a great tool for comparing companies within the same industry.
2. Debt-to-Equity (D/E) Ratio: This tells you how much debt a company is using to finance its assets relative to shareholder equity. A high D/E ratio might indicate higher risk, especially in volatile markets. It’s important to compare this ratio across similar companies.
3. Return on Equity (ROE): ROE measures how effectively a company uses shareholders’ equity to generate profits. A higher ROE is generally a good sign of strong financial performance and efficient management.
4. Current Ratio: This liquidity ratio compares a company’s current assets to its current liabilities. A ratio above 1 means the company can cover its short-term obligations, which is a sign of financial stability.
5. Dividend Yield: If you’re interested in income from your investments, this ratio shows how much a company pays out in dividends each year relative to its stock price. It’s especially useful for evaluating income-generating stocks.
By keeping these ratios in mind, you can gain valuable insights into a company’s financial health and make more informed investment choices. Remember, no single ratio tells the whole story — always look at the bigger picture and consider multiple metrics together.
KOSPI vs KOSDAQ and Market Structure

If you’re exploring the South Korean stock market, you’ve likely come across two major indices: KOSPI and KOSDAQ. While both are essential parts of Korea’s financial ecosystem, they serve different purposes and cater to different types of companies and investors.
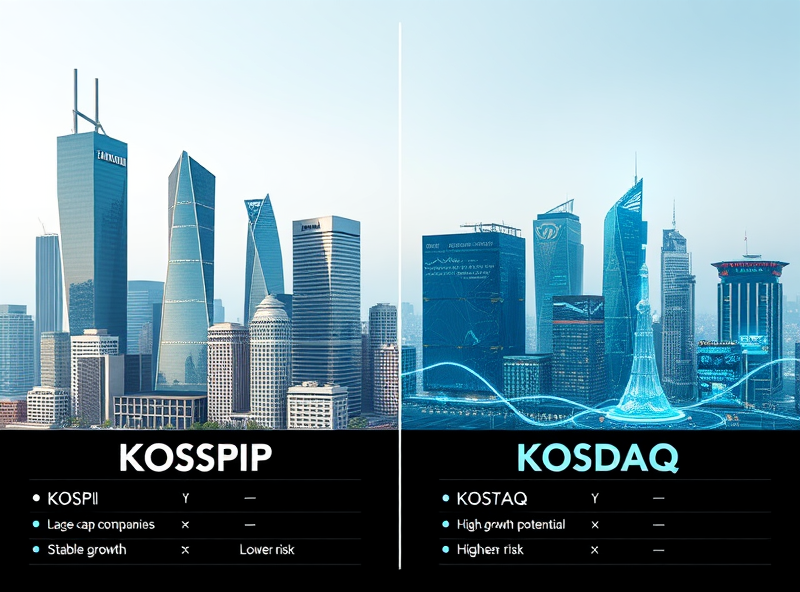
KOSPI, or the Korea Composite Stock Price Index, represents the main board of the Korea Exchange (KRX). It includes large, well-established companies such as Samsung Electronics and Hyundai Motor. Think of KOSPI as Korea’s equivalent to the S&P 500 — a benchmark for blue-chip stocks. Companies listed on KOSPI typically have a strong financial history, large market capitalization, and are subject to stricter listing requirements.
On the other hand, KOSDAQ (Korean Securities Dealers Automated Quotations) is more similar to the U.S. NASDAQ. It focuses on small to mid-sized companies, especially in the tech and biotech sectors. KOSDAQ offers more growth potential but also comes with higher risk, making it attractive to investors who are willing to take on more volatility for the chance of higher returns.
Understanding the structure of the Korean stock market helps investors make more informed decisions. The Korea Exchange (KRX) is the sole securities exchange operator in South Korea and is divided into three segments: KOSPI Market, KOSDAQ Market, and the KONEX Market (for even smaller startups).
For beginners, knowing the difference between KOSPI and KOSDAQ can help tailor your investment strategy. If you prefer stability and long-term growth, KOSPI might be more suitable. If you’re looking for high-growth opportunities and are comfortable with risk, KOSDAQ could be the right choice.
Whether you’re a local investor or someone interested in international markets, understanding these distinctions can help you diversify your portfolio wisely and align your investments with your financial goals.


답글 남기기